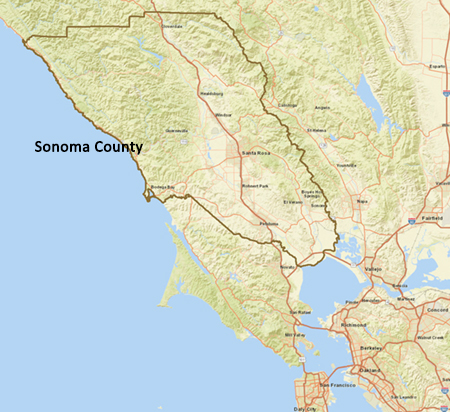
Sonoma County Population
| Population | 495,319 |
|---|---|
| Avg Size Household | 2.57 |
| Households | 188,317 |
| Median Age | 41.1 |
| Median Household Income | $81,477 |
| Median Home Value | $603,944 |
| Housing Affordability | 67 |
| Internet at Home | 93% |

Population & Businesses

473,673
Daytime Population

24,833
Total Businesses

202,633
Total Employees
Poverty

13,1625
Households Receiving Food Stamps/Snap

18,337
Households Below the Poverty Level
At-Risk Population

46,328
Households With Disability

93,546
Population 65+

9,242
Households Without Vehicle
Health Insurance Coverage (ACS)
| Coverage | 0 – 18 | 19 – 34 | 35 – 64 | 65 & over |
|---|---|---|---|---|
| No Insurance | – | 3.3% | 4.2% | 0.1% |
| VA Health Care | – | 0.1% | 0.2% | 0.0% |
| Medicaid | – | 2.8% | 3.8% | 1.2% |
| Medicare | – | 0.1% | 0.5% | 4.1% |
| Direct Purchase | – | 2.2% | 5.3% | 0.1% |
| Employer Insurance | – | 10.7% | 23.2% | 0.5% |
| Population | 4,244 | 16,133 | 21,069 | 504 |
No Health Insurance Coverage
| Population <19 | .8% | 4,244 |
|---|---|---|
| Population Age 19-34 | 3.3% | 16,133 |
| Population Age 35-64 | 4.2% | 21,069 |
| Population Age 65+ | 0.1% | 504 |
Senior Population
| Gender | Female | Male |
|---|---|---|
| 65-69 | 17,047 | 4,837 |
| 70-74 | 13,082 | 1,260 |
| 75-79 | 8,344 | 6,815 |
| 80-84 | 5,616 | 4,083 |
| 85+ | 8,074 | 4,388 |
Population by Age
| Population <18 | 21% |
|---|---|
| Population Age 18 – 64 | 61.0% |
| Population Age 65+ | 19.0% |
Key Indicators: Impact Planning
Population by Language
| Language | Age 5-17 | Age 18-64 | Age65+ | Total |
|---|---|---|---|---|
| English Only | 49,128 | 228,265 | 76,042 | 353,435 |
| Spanish Only | 24,102 | 64,314 | 5,302 | 93,718 |
| Indo-European | 1,227 | 8,365 | 3,340 | 12,932 |
| Indo-European & English Well | 1,173 | 7,860 | 3,004 | 12,037 |
| Indo-Euro & English Not Well | 54 | 462 | 315 | 831 |
| Asian-Pacific Island | 1,058 | 8,994 | 2,177 | 12,229 |
| Asian-Pacific Isl & English Well | 950 | 7,579 | 1,139 | 9,668 |
| Asn-Pacific Isl & English Not Well | 108 | 1,306 | 759 | 2,173 |
| Other Language | 246 | 1,920 | 278 | 2,444 |
| Other Language & English Well | 246 | 1,858 | 237 | 2,341 |
| Other Lang. & English Not Well | 0 | 54 | 0 | 54 |
School Enrollment (ACS)
| Preschool | 6,815 |
|---|---|
| Kindergarten | 6,724 |
| Grade 1-4 | 21,744 |
| Grade 5-8 | 23,326 |
| Grade 9-12 | 24,631 |
| College | 33,315 |
| Graduate/Professor | 4,708 |
Population & Poverty Status (ACS)
| Status | Total |
|---|---|
| Population for whom Poverty Status is Determined | 494,366 |
| Income to Poverty Ratio <0.50 | 23,108 |
| Income to Poverty Ratio 0.50-0.99 | 29,599 |
| Income to Poverty Ratio 1.00-1.24 | 18,999 |
| Income to Poverty Ratio 1.25-1.49 | 17,430 |
| Income to Poverty Ratio 1.50-1.84 | 28,968 |
| Income to Poverty Ratio 1.85-1.99 | 11,950 |
| Income to Poverty Ratio 2.00+ | 364,312 |
Poverty Levels
| Levels | Below | Above | Total |
|---|---|---|---|
| Total all Levels | 18,337 | 171,721 | 190,058 |
| Married Couple Families | 3,531 | 87,286 | 90,817 |
| Other Families w/Male Householder | 846 | 9,099 | 9,945 |
| Other Families w/Female Householder | 3,432 | 16,195 | 19,627 |
| Nonfamilies w/Male Householder | 4,206 | 25,713 | 29,919 |
| Nonfamilies w/Female Householder | 6,322 | 33,428 | 39,750 |
